 SEARCH
 UPLOAD
 ABOUT
ABOUT CONTACT
Search results
Namibian Wildlife Surveys archive
This archive of reports of wildlife surveys in Namibia aims to:
- provide easy public access to published information and statistics
- enable easy stakeholder access to recent and historical data on wildlife populations
- provide a comprehensive archive of wildlife survey reports in Namibia
Public access to information is a vital component of ensuring community engagement in prevalent issues. Wildlife surveys are critical to determine the health of wildlife populations and determine trends over time to guide conservation and management actions.
Wildlife surveys are done for different species using methods that are suited to counting them (e.g. by air or road) in their natural habitats. Such surveys need to be repeated over time to detect long-term trends and inform conservation managers. The Namibian government, non-governmental organisations and private reserves all conduct regular surveys covering different parts of Namibia and targeting different species. This archive will thus serve as a repository of our collective knowledge of the trends and status of a variety of species occurring throughout Namibia.
Explore your search results using the filter checkboxes, or amend your search or start a new search.
| Attachment | Size |
|---|---|
| Zambezi Game Count_Bwabwata 2019.pdf | 748.18 KB |
| Attachment | Size |
|---|---|
| North West Game Count_North of Vet Fence 2019.pdf | 599.7 KB |
Accurately estimating hippopotamus (Hippopotamus amphibius) numbers is difficult due to their aggressive nature, amphibious lifestyle, and habit of diving and surfacing. Traditionally, hippos are counted using aerial surveys and land/boat surveys. We compared estimates of numbers of hippos in a lagoon in the Okavango Delta, counted from land to counts from video taken from a DJI Phantom 4TM drone, testing for effectiveness at three heights (40 m, 80 m, and 120 m) and four times of day (early morning, late morning, early afternoon, and late afternoon).
| Attachment | Size |
|---|---|
| Drone_based effective counting and ageing of hippopotamus in the Okavango Delta in Botswana.pdf | 893.17 KB |
From 2016 onwards Bamunu (2) was included in counts. In 2018 the two Protected Areas Mudumu (7) and Nkasa Ruparo (8) were not included in counts. It is important to bear this in mind when interpreting tables, charts and a time series of posters.
| Attachment | Size |
|---|---|
| Zambezi Game Count_East 2019.pdf | 544.93 KB |
| Attachment | Size |
|---|---|
| North West Game Count_Hobatere 2019.pdf | 581.69 KB |
An aerial survey of wildlife and domestic livestock took place in Zambezi Region from 25 th September to 4 th October 2019 as part of a wider survey including Khaudum National Park and its neighbouring conservancies. A total area of 17 380km2 was sampled at intensities between 10 and 40%. The estimates of numbers of each species are tabulated below. The estimated number of elephants is lower than that from the 2015 survey, but the change is not statistically significant. There were considerably fewer elephant carcasses seen in 2019.
| Attachment | Size |
|---|---|
| Hardap Game Count 2019 final.pdf | 693.66 KB |
An aerial survey of wildlife and domestic livestock took place in the Khaudum National Park and its neighbouring areas from 18th to 23th September 2019 as part of a wider survey including Zambezi Region. A total area of 14029 km2 was sampled at intensities from 5% to 20%. The estimated numbers of numbers of each species are given in the table below. The increase in estimated numbers of elephants since 2013 has been greater than expected from natural reproduction, but the overall trend from 1998 shows an average rate of increase of 4.4% per annum.
The waterhole fool-moon game count survey was conducted during the hottest period of the year (October) for a duration of 72 hours (3 days and 3 nights), which ensured that wildlife in the park is solely dependent on artificial water points. The survey was conducted at all the 13 water points (11 artificial and 2 fountains), with each water point having a team of eight people, working in shifts. The counting commenced on 12 October 2019, a day before the full moon and finished on 15 October 2019, a day after the full moon.
| Attachment | Size |
|---|---|
| Khaudum National Parks full moon waterhole game count_October 2019.pdf | 1.06 MB |
The north-west of Namibia has a small population of the desert dwelling elephants (Loxodonta africana africana), 357 were identified in 1983 (Viljoen, 1987) and 600 were reported in 2014 (MET, 2014). Desert-dwelling elephants, in Namibia's hyper-arid northwest region, are considered very special due to their adaptations that help them survive a difficult existence in the world´s oldest desert (Figure 1,2). They are vulnerable to many factors.
| Attachment | Size |
|---|---|
| Conservation of desert_dwelling elephants in Namibia_status and challenges.pdf | 293.21 KB |
| Attachment | Size |
|---|---|
| Kavango East poster 2019 Final.pdf | 767.43 KB |
If you have had the privilege of spending plenty of time watching wildlife in Africa's wilderness areas, it is likely that you have spotted an animal wearing a collar. In the context of a safari in the wilderness the presence of a clunky leather collar around the neck of a majestic lion or elephant may seem out of place and even jarring, as it reminds us that man's impact on the environment extends right into the lives of individual animals. This may leave you wondering: why are collars necessary? What benefit do the animals get from humans catching and collaring them?
| Attachment | Size |
|---|---|
| Gaining insights into the secret lives of wild animals.pdf | 7.83 MB |
| Attachment | Size |
|---|---|
| Game counts in north_west Namibia_Palmwag and Etendeka_June 2018.pdf | 662.25 KB |
Summary of game counts in north-west Namibia: Conservancies north of the veterinary fence, June 2018.
| Attachment | Size |
|---|---|
| Game counts in north_west Namibia_Conservancies north of the veterinary fence_June 2018.pdf | 622.61 KB |
| Attachment | Size |
|---|---|
| North Central Game Count data 2018.xlsx | 146.33 KB |
Summary of game counts in north-west Namibia: Conservancies north of the veterinary fence, June 2018.
| Attachment | Size |
|---|---|
| Game counts in north_west Namibia_Conservancies north of the veterinary fence_June 2018.pdf | 622.61 KB |
Carnivore populations face threats from increasing human populations and rapidly diminishing, suitable habitat. Large carnivores such as African lions (Panthera leo) commonly range outside of their protected areas and attack livestock on adjacent farmlands. This can lead to human-carnivore conflict (HCC) events often resulting in retaliatory lion killings. HCC retaliation by poisoning the offending animals is highly costly to lions due to the species’ group hunting and feeding habits.
| Attachment | Size |
|---|---|
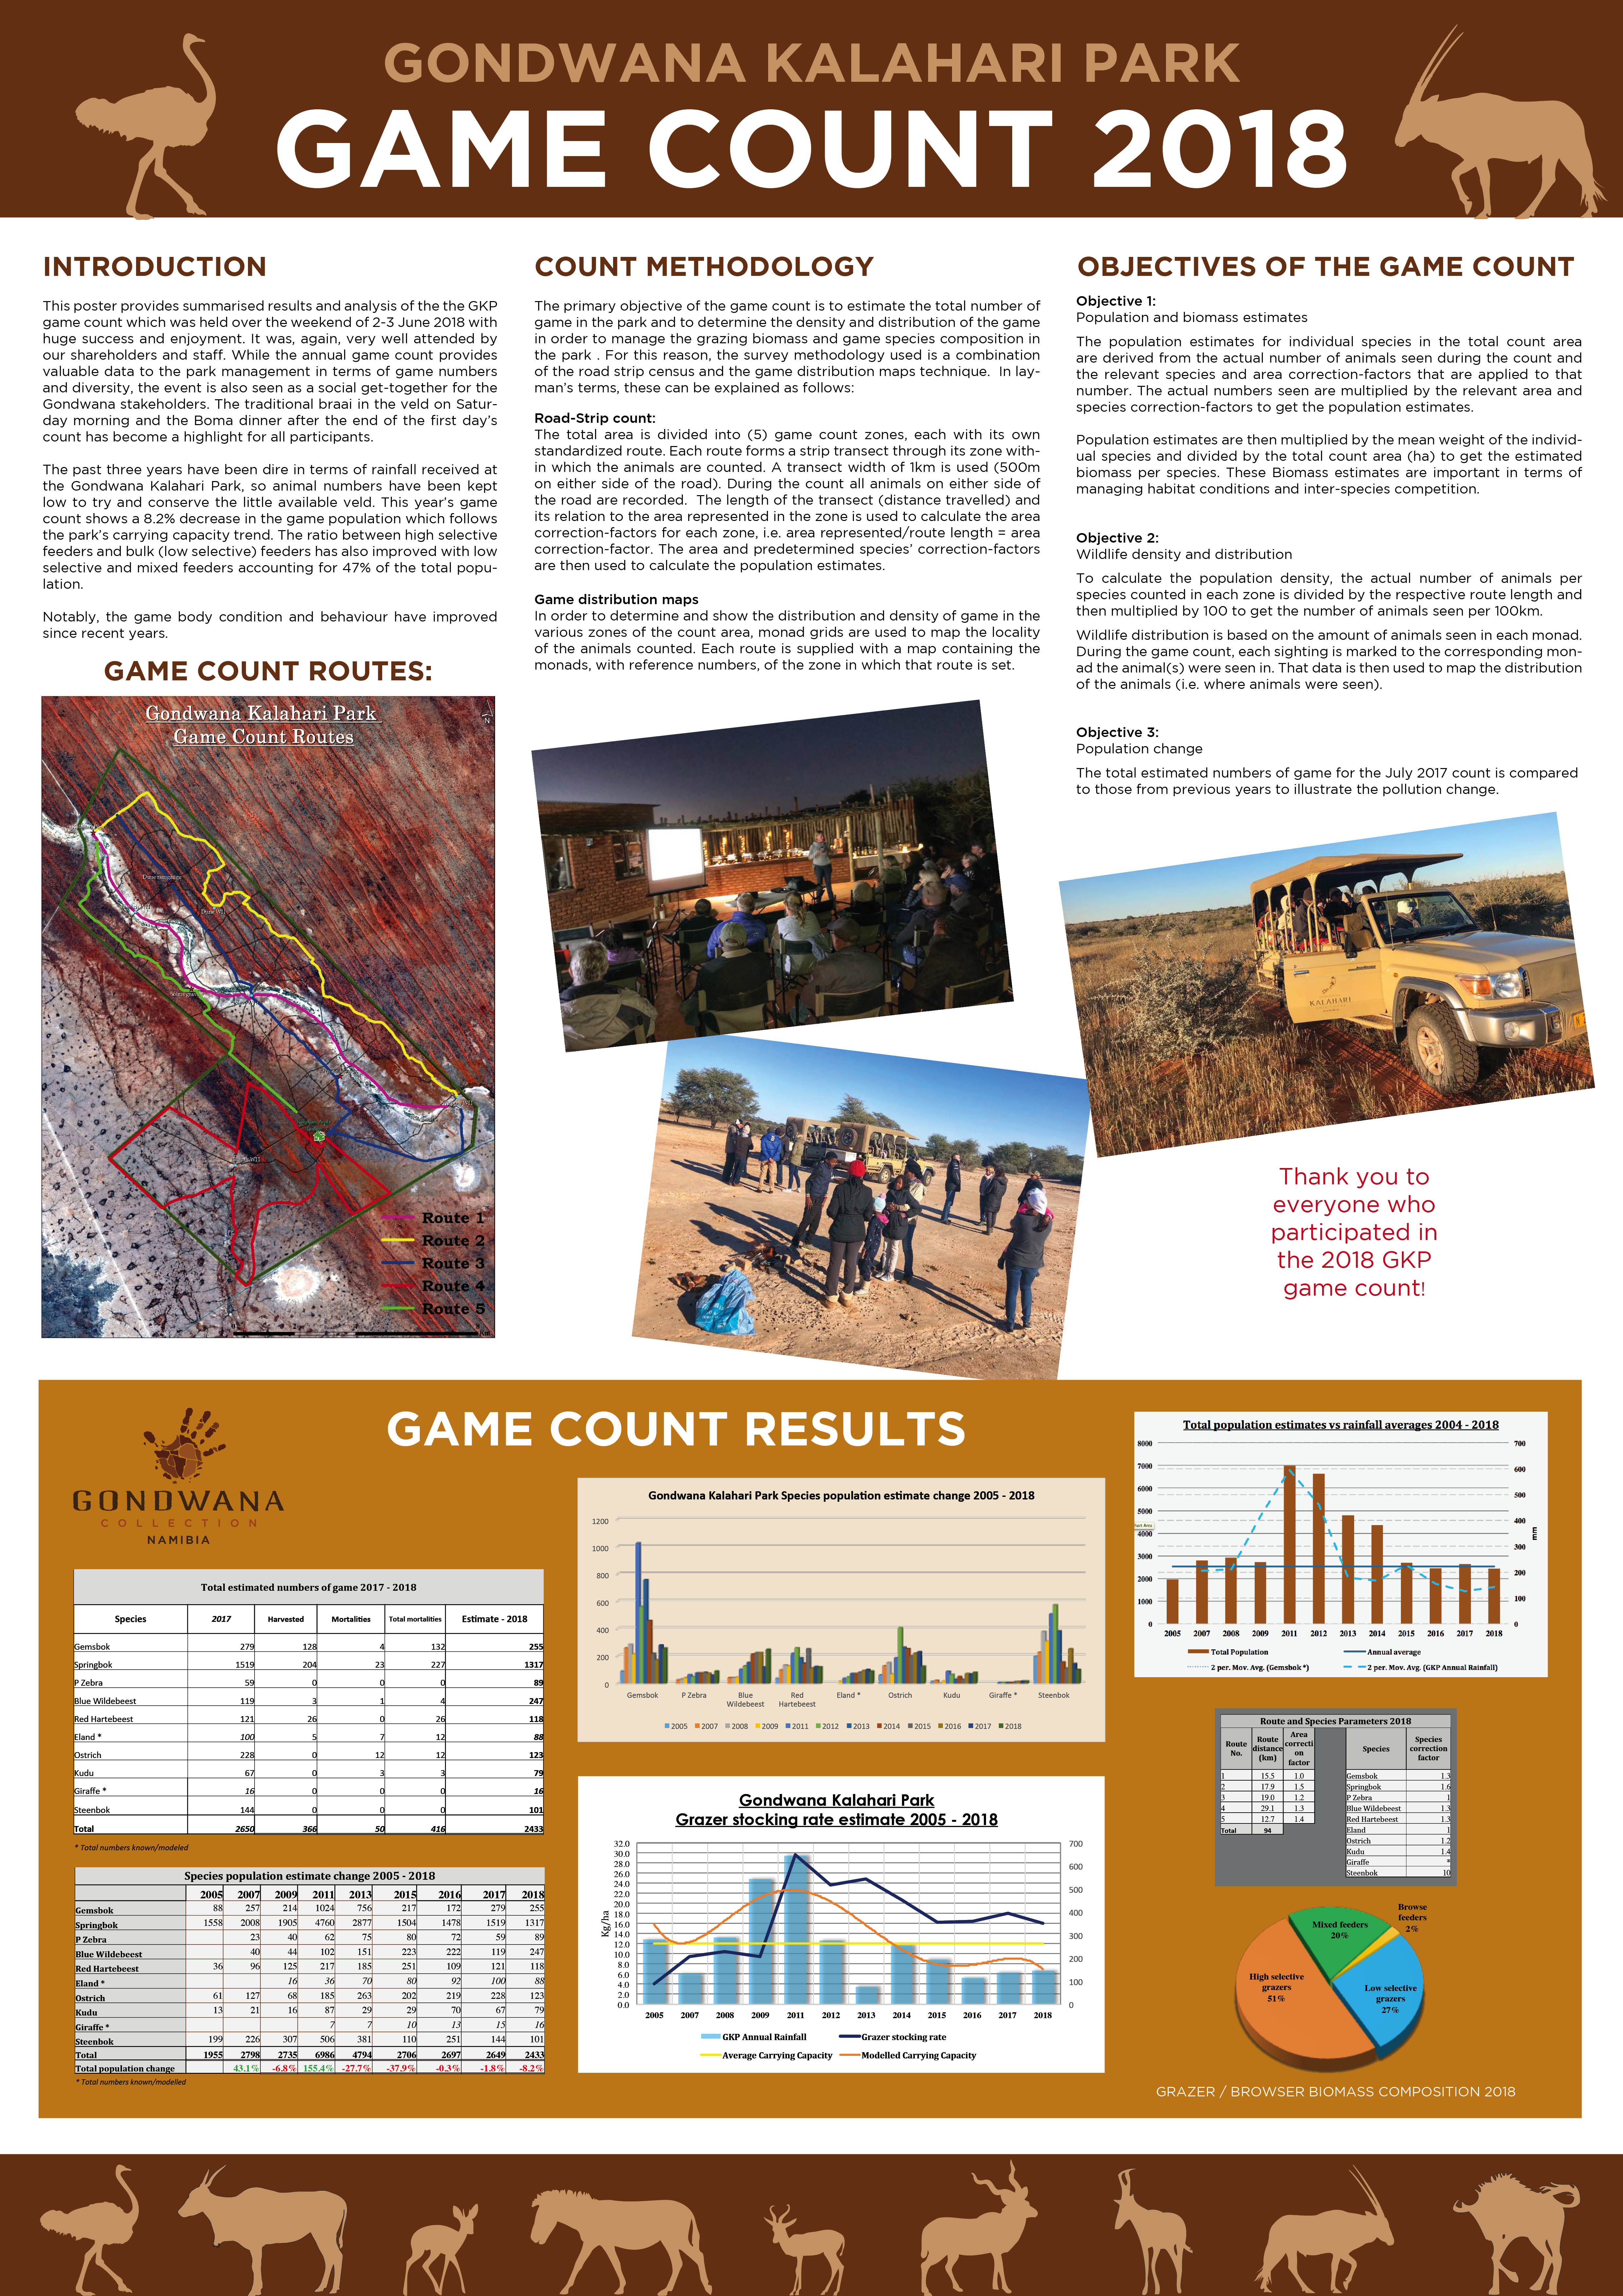
| Gondwana Kalahari Park Game Count 2018.jpg | 3.15 MB |
| Attachment | Size |
|---|---|
| Game counts in north_west Namibia_ Regional Summary_2018.pdf | 1.12 MB |
| Attachment | Size |
|---|---|
| Game counts in southern Namibia_June 2018.pdf | 759.21 KB |
| Attachment | Size |
|---|---|
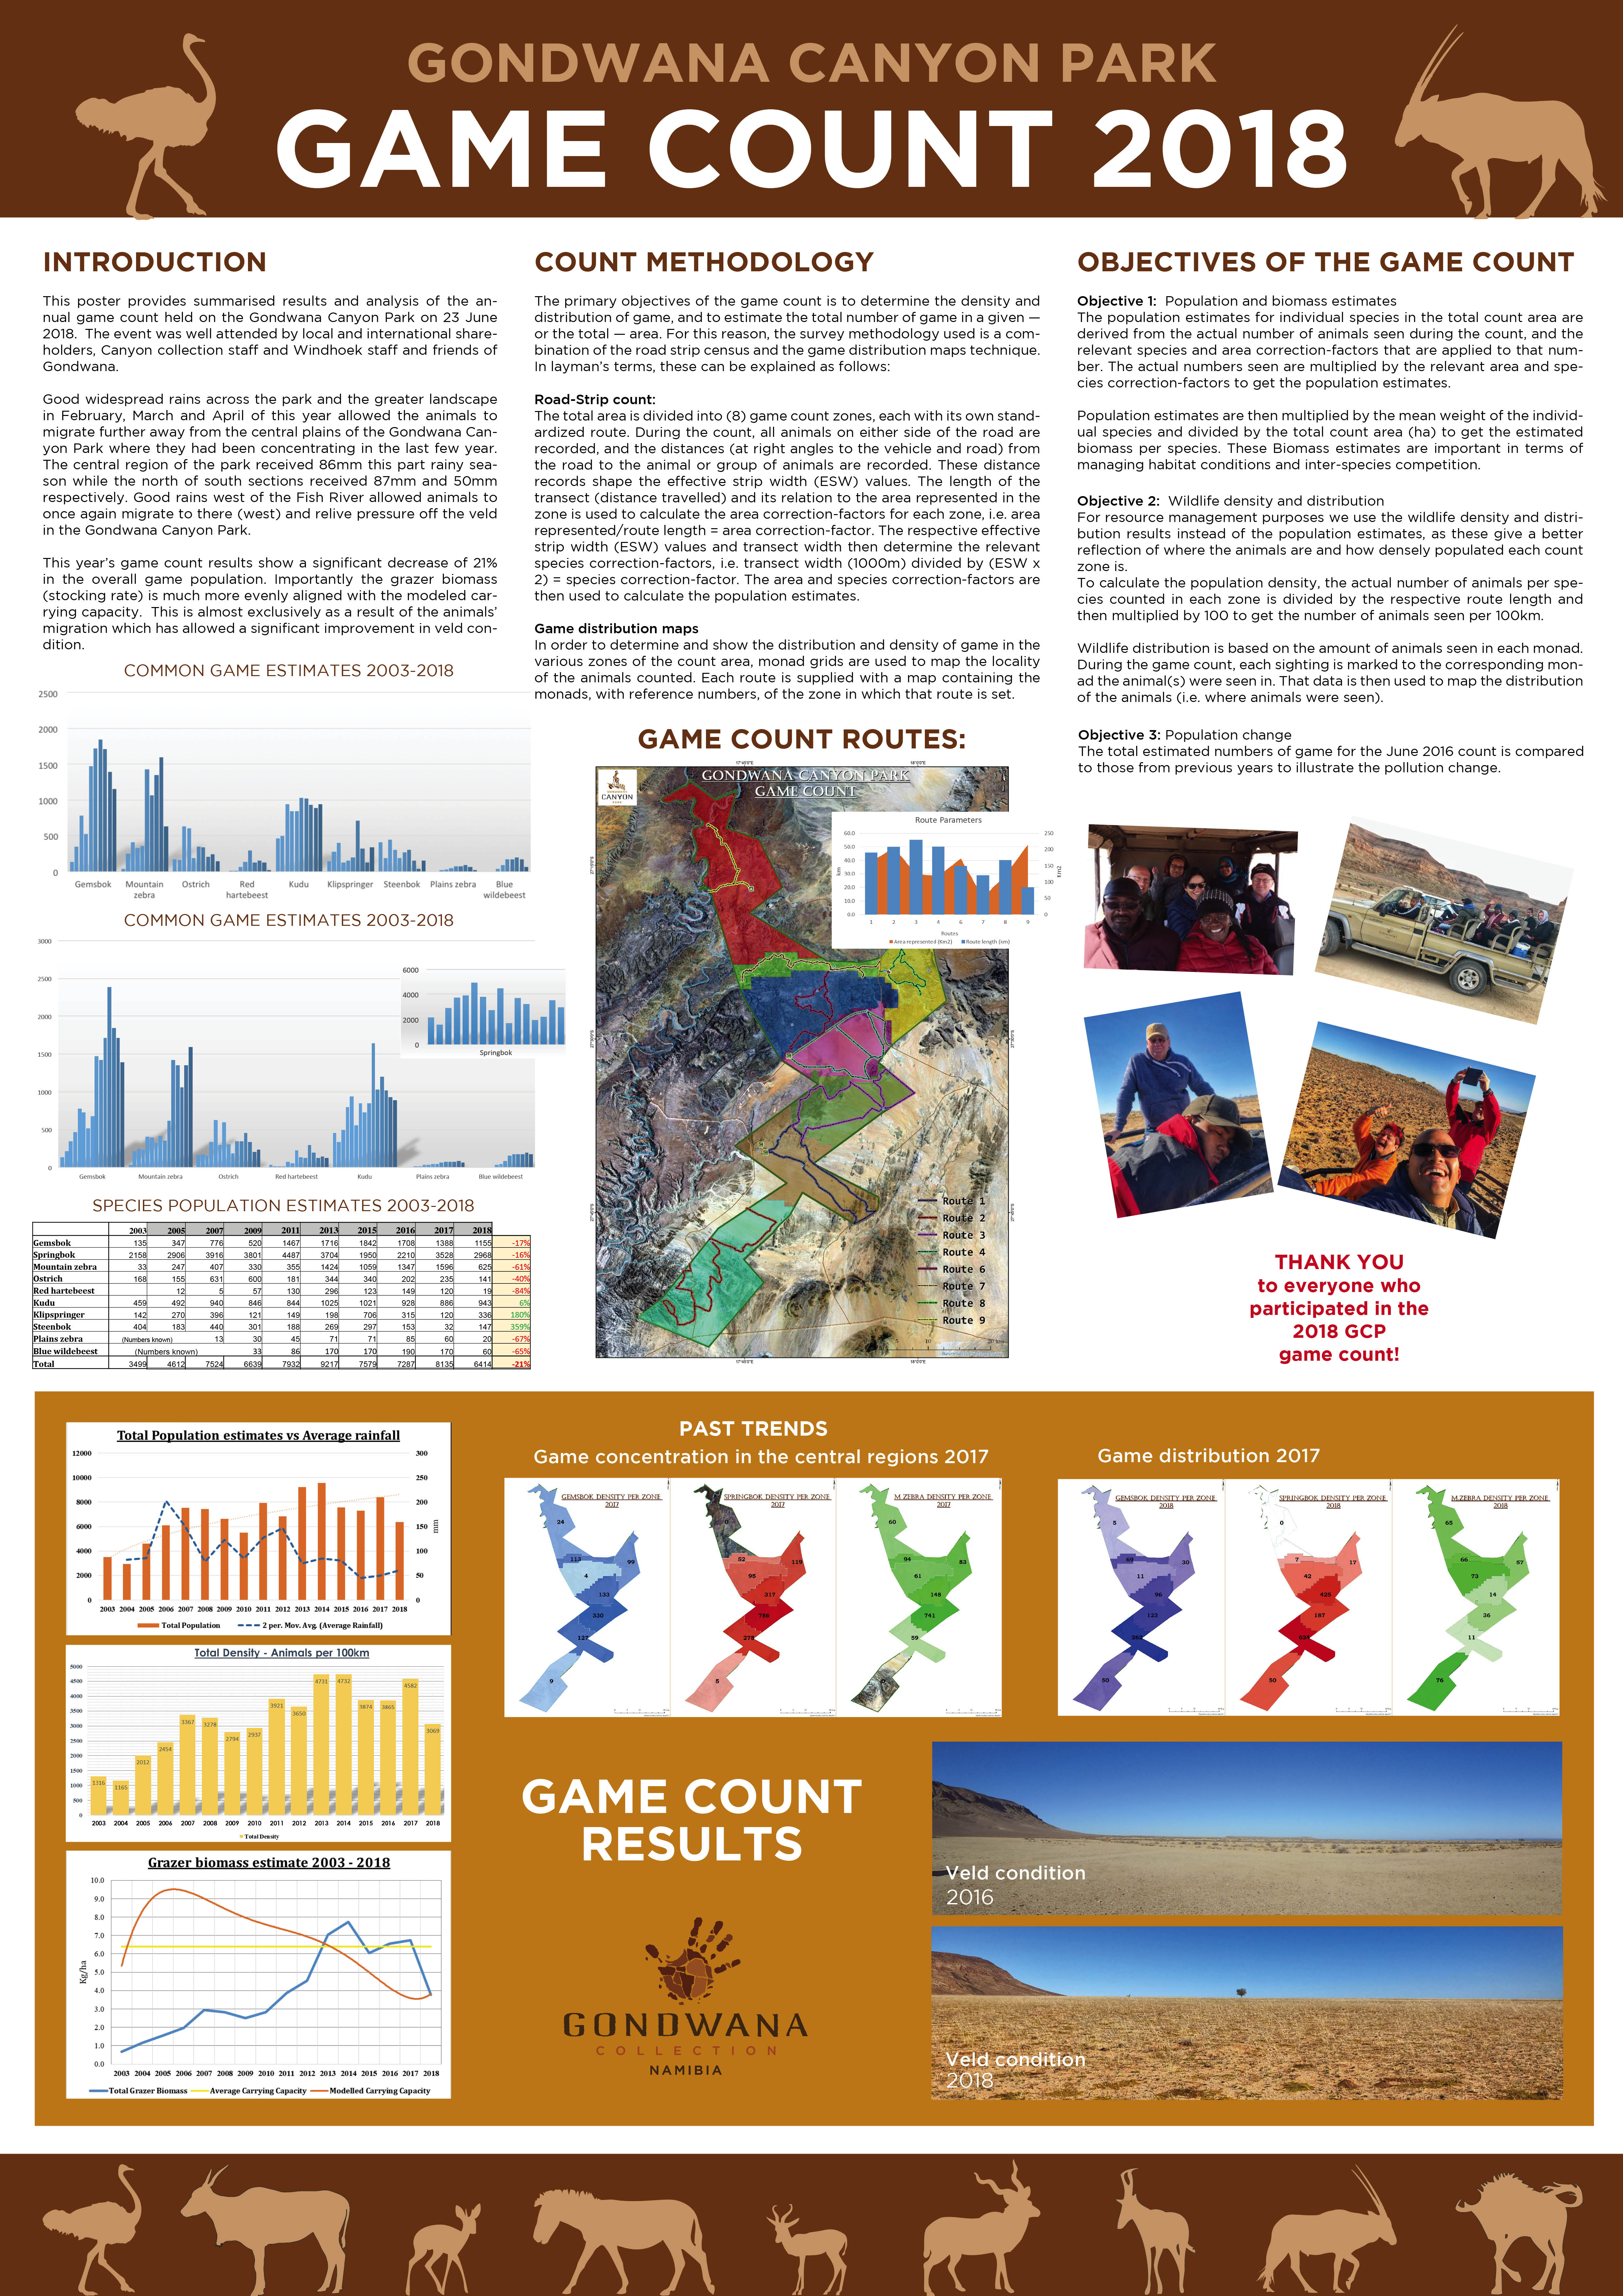
| Gondwana Canyon Park Game Count 2018.jpg | 3.01 MB |
| Attachment | Size |
|---|---|
| North West Game Count data 2018.xlsx | 434.86 KB |
Summary of game counts in north-central Namibia: Total Numbers of animals seen: last 5 years.
| Attachment | Size |
|---|---|
| Game counts in north_central Namibia_Total Numbers of animals seen_last 5 years_2018.pdf | 850.88 KB |
We compiled data from our research (2006-2018) along with published accounts dating back to 1975 on the desert-dwelling elephant population in our study area of Skeleton Coast National Park and western Kunene region. This includes the Hoarusib-Hoanib, and Uniab subpopulations. Our analysis of the data reveal the profound influence that humancaused mortality has had on the population. An initial precipitous decline occurred due to wartime poaching (1980s).
| Attachment | Size |
|---|---|
| Game counts in Hardap Game Park_July 2018.pdf | 772.41 KB |
| Attachment | Size |
|---|---|
| Game counts in north_west Namibia_Hobatere concession_June 2018.pdf | 581.38 KB |
Carnivore populations face threats from increasing human populations and rapidly diminishing, suitable habitat. Large carnivores such as African lions (Panthera leo) commonly attack livestock on lands adjacent to protected areas. This can lead to human-wildlife conflict (HWC) events that result in retaliatory lion killings. Conflict is a primary driver of wild lion population declines which are estimated to have decreased by 43% in the last 20 years.
| Attachment | Size |
|---|---|
| Etosha National Park Carnivore Monitoring Project_Lion GPS_Satelllite Monitoring.pdf | 2.09 MB |
Summary of game counts in north-central Namibia, July 2017.
| Attachment | Size |
|---|---|
| Game counts in north_central Namibia_July 2017.pdf | 1.13 MB |
| Attachment | Size |
|---|---|
| South Game Count data up to 2017.xlsx | 89.28 KB |
Summary of game counts in Bwabwata NP, Dry season - Live sightings, 2017.
| Attachment | Size |
|---|---|
| Game counts in Bwabwata NP_Dry season _Live sightings_2017.pdf | 1.01 MB |
The Iona National Park covers about 15,200 km2 or 1.52 million hectares of Angola's Namibe Province in the south-western part of the country. It is the largest national park in Angola. It is bounded by the Atlantic Ocean to the west, an escarpment to the east that marks the beginning of the interior plateau, the Curoca River to the north, and the Cunene River to the south. It is about 200 kilometres south of the town of Namibe. Iona was proclaimed as a reserve in 1937 and upgraded to a national park in 1964.
Summary of game counts in north-west Namibia: Regional Summary.
| Attachment | Size |
|---|---|
| Game counts in north_west Namibia_Regional Summary_June 2017.pdf | 1.01 MB |
Summary of game counts in east Zambezi, Dry season - Live sightings, 2017.
| Attachment | Size |
|---|---|
| Game counts in east Zambezi_Dry season_Live sightings_2017.pdf | 890.83 KB |
Summary of 2017 game counts: Kavango east.
| Attachment | Size |
|---|---|
| 2017 game counts_Kavango east.pdf | 945.05 KB |
Summary of game counts in southern Namibia, May 2017.
| Attachment | Size |
|---|---|
| Game counts in southern Namibia_May 2017.pdf | 997.6 KB |
| Attachment | Size |
|---|---|
| Aerial count of the roan antelope and other wildlife species in Khaudum National Park_2016.pdf | 2.56 MB |
Summary of game counts in Hardap Game Park, May 2017.
| Attachment | Size |
|---|---|
| Game counts in Hardap Game Park_May 2017.pdf | 1.04 MB |
Summary of North Central Game Count data up to 2017.
| Attachment | Size |
|---|---|
| North Central Game Count data up to 2017.xlsx | 143.47 KB |
Summary of game counts in north-west Namibia: Hobatere concessions area, June 2017.
| Attachment | Size |
|---|---|
| Game counts in north_west Namibia_Hobatere concessions area_June 2017.pdf | 1.06 MB |
Summary of game counts in north-west Namibia: Palmwag and Etendeka concessions, June 2017.
| Attachment | Size |
|---|---|
| Game counts in north_west Namibia_Palmwag and Etendeka concessions_June 2017.pdf | 938.7 KB |
This research project deploys satellite tracking collars on ungulates in the GSNL and monitors their movements as well as other environmental parameters. Its objective is to document movement corridors and identify impediments to migration routes for springbok, oryx and Hartmann’s mountain zebra. Stefanie Urban successfully completed her Bachelor of Natural Resources Management (Honours) project at NUST at the end of 2016. Her project report is available on request.
| Attachment | Size |
|---|---|
| Tracking ungulate movements.pdf | 2.23 MB |
Summary of game counts in north-west Namibia: Conservancies north of the veterinary fence, June 2017.
| Attachment | Size |
|---|---|
| Game counts in north_west Namibia_Conservancies north of the veterinary fence_June 2017.pdf | 909.79 KB |
| Attachment | Size |
|---|---|
| North West Game Count data up to 2017.xlsx | 423.04 KB |
Of the animals that had a comparable number of location pings, Oryx 1768 on Keerweder, Hartmann's zebra 1771 on Solitaire and Oryx 1770 on Aandster moved the furthest daily distances with 9.57 km, 7.87 km and 7.35 km respectively. Three animals were collared at the end of July/ beginning of August, including Springbok 132 (after the last one with the same collar id. died in March) and 133, Hartmann's zebra 1775 and 1776. Hartmann's zebra 1776, which is currently ranging on Neuras, moved a considerable mean daily distance of 9.22 km.
| Attachment | Size |
|---|---|
| GSNLNewsletter_1_3.pdf | 1.43 MB |
| Attachment | Size |
|---|---|
| Gondwana Canyon Park Game Count 2016.jpg | 6.98 MB |

Summary of game counts in north-west Namibia: Hobatere concessions area, June 2016.
| Attachment | Size |
|---|---|
| Game counts in north_west Namibia_Hobatere concessions area_June 2016.pdf | 794.73 KB |
Oryx 1770 and Zebra 1771 covered the most distance with 921.62 km and 877.36 km respectively (assuming a straight line between each ping). Mean daily distances have overall increased since the last period, possibly due to isolated rainfall during the period. Zebra 1773 has possibly been killed or the collar fell off, this is currently under investigation. Note: The mean daily distances in the last newsletter were not correct as they were distances between each ping. They should be multiplied by three to get the mean daily distance.
| Attachment | Size |
|---|---|
| GSNL wildlife monitoring Newsletter_2_2016.pdf | 1.94 MB |